What is the ConnorsRSI?
It consists of three components:
a. Short term Relative Strength, i.e., RSI(3).
b. Counting consecutive up and down days (streaks) and "normalizing" the data using RSI(streak,2). The result is a bounded, 0-100 indicator.
c. Magnitude of the move (percentage-wise) in relation to previous moves. This is measured using the percentRank() function.
The formula given is:
ConnorsRSI(3,2,100) = [ RSI(Close,3) + RSI(Streak,2) + PercentRank(percentMove,100) ] / 3
Bottom line: Connors/Alvarez have used similar indicators in the past. What is happening here is that they are creating a more robust indicator by averaging the three. They are "normalizing" the three indicators (rsi, consecutive moves and magnitude of move) to a 0-100 range and then averaging.
Connors/Alvarez propose a strategy that uses the Connors RSI coupled with other rules and filters on large section of U.S. Stocks.
In this post we'll test the indicator on one security only, the SPY etf (as a proxy for the SP500).
Test A -
Instrument - SPY
1. Using ConnorsRSI(3,2,100) - We 'll call it Crsi.
2. Buy on Crsi<15
3. Sell on Crsi>70
4. Buy /Sell on the next bar Open price.
5. Commision of $0.005.
Test B -
The obvious question is whether the parameters are "fitted" to the data. What about using other parameters:
ConnorsRSI(a,b,c)
a-->2-4
b-->2-4
c-->80-140
BuyThreshold -->5-50
BuyThreshold -->50-95
What about before 1994? We 'll use ^GSPC (the SP500 Index).
Same parameters as "Test A"
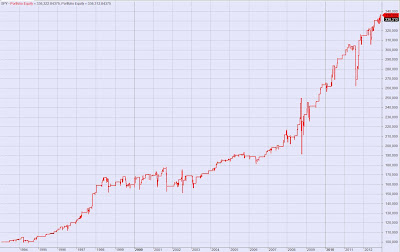
Detailed results Test A
All trades
Initial capital 100000
Ending capital 336322.84
Net Profit 236322.84
Net Profit % 236.32%
Exposure % 6.55%
Net Risk Adjusted Return % 3606.42%
Annual Return % 6.30%
Risk Adjusted Return % 96.17%
All trades 179
Avg. Profit/Loss 1320.24
Avg. Profit/Loss % 0.73%
Avg. Bars Held 4.77
Winners 136 (75.98 %)
Total Profit 439687.37
Avg. Profit 3233
Avg. Profit % 1.71%
Avg. Bars Held 3.93
Max. Consecutive 11
Largest win 15964.53
# bars in largest win 3
Losers 43 (24.02 %)
Total Loss -203364.52
Avg. Loss -4729.41
Avg. Loss % -2.37%
Avg. Bars Held 7.42
Max. Consecutive 3
Largest loss -35059.29
# bars in largest loss 10
Max. trade drawdown -58157.34
Max. trade % drawdown -23.75%
Max. system drawdown -58157.34
Max. system % drawdown -23.28%
Recovery Factor 4.06
CAR/MaxDD 0.27
RAR/MaxDD 4.13
Profit Factor 2.16
Payoff Ratio 0.68
Standard Error 20256.9
Risk-Reward Ratio 0.5
Ulcer Index 3.5
Ulcer Performance Index 0.26
Sharpe Ratio of trades 2.23
K-Ratio 0.0404


